Crosscorrelation
Crosscorrelation can be used to compare the phase between two time series. It is the same mathematical calculation as autocorrelation, except that two data sets are used instead of one. It can identify the phase difference between two signals sharing a common frequency. The two datasets are compared point for point to calculate r, then lagged and r is calculated again. The resulting cross-correlogram will show a peak at lag zero if the data are in phase. Displacement of the first peak from lag zero in either direction is a direct measure of the phase difference between the two rhythms (Dowse, 2007). A reference data set may be compared to the data set of interest, for results normalized to a constant standard, or two data sets may be compared directly to find the difference in phase between them.
For the purposes of a study, a reference point may be different things. In the case of a study of the relationship between an entraining agent (light/dark), and the rhythm it entrains (e.g., blood pressure, activity), an appropriate reference time may be a stage of the entrainer, such as dark onset (assuming a synchronized relationship has been established). To investigate potential entraining agents for a rhythm, it may be necessary to record multiple potential reference points, and compare each to a reference point, to see which has a consistent phase relationship with the rhythm under study, possibly using a phase response curve (PRC), which plots changes of phase as a function of when a stimulus pulse (e.g., light) is administered (Levine et al., 2002).
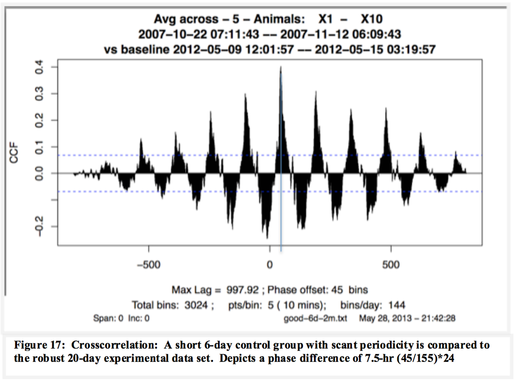
Interpretation: Two mouse activity data sets with similar periods are crosscorrelated using CAT in Figure 17. A 6-day data set with weak approximate 24-hr periodicity is compared against a 20-day data set with a similar robust rhythm, and in this case, the average of 5 animals from each data set was compared. The peak in correlation occurs at the lag corresponding to 45 bins (144 bins in a day), revealing a 7.5-hr phase difference between the two data sets. Note the largest r is below 0.4, and the peaks attenuate. The extent of decay in the envelope of the crosscorrelation reflects the difference in the periods (Dowse, 2007). The periods present in each data set should be similar for a clean analysis of phase using crosscorrelation.
For the purposes of a study, a reference point may be different things. In the case of a study of the relationship between an entraining agent (light/dark), and the rhythm it entrains (e.g., blood pressure, activity), an appropriate reference time may be a stage of the entrainer, such as dark onset (assuming a synchronized relationship has been established). To investigate potential entraining agents for a rhythm, it may be necessary to record multiple potential reference points, and compare each to a reference point, to see which has a consistent phase relationship with the rhythm under study, possibly using a phase response curve (PRC), which plots changes of phase as a function of when a stimulus pulse (e.g., light) is administered (Levine et al., 2002).
Interpretation: Two mouse activity data sets with similar periods are crosscorrelated using CAT in Figure 17. A 6-day data set with weak approximate 24-hr periodicity is compared against a 20-day data set with a similar robust rhythm, and in this case, the average of 5 animals from each data set was compared. The peak in correlation occurs at the lag corresponding to 45 bins (144 bins in a day), revealing a 7.5-hr phase difference between the two data sets. Note the largest r is below 0.4, and the peaks attenuate. The extent of decay in the envelope of the crosscorrelation reflects the difference in the periods (Dowse, 2007). The periods present in each data set should be similar for a clean analysis of phase using crosscorrelation.